In this article: we’ll show you how to gain valuable insights into how your app is used, how many downloads occurred over a given amount of time, and more.
The Analytics portion of the your admin panel / CMS provides powerful tools for you to see:
- Number of downloads
- Total number of sessions (user sessions begins when the user accesses the application and ends when the user quits the application)
- Average time in the app
- Users by day
- Your most popular tabs/features
- In your admin panel / CMS navigate to Manage > Analytics.
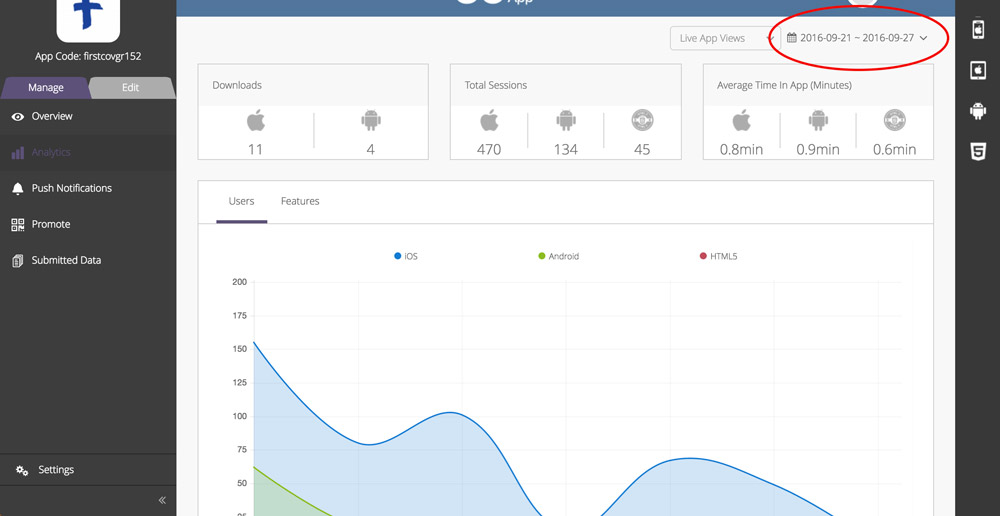
- Before viewing any data, go to the top right of this page and adjust the date range you would like to see. Live App Views show data for your app in the app stores, Previews are for your app within the Preview App.

- The Downloads, Total Sessions, Average Time In App and graphs will adjust automatically after selecting a new date range.
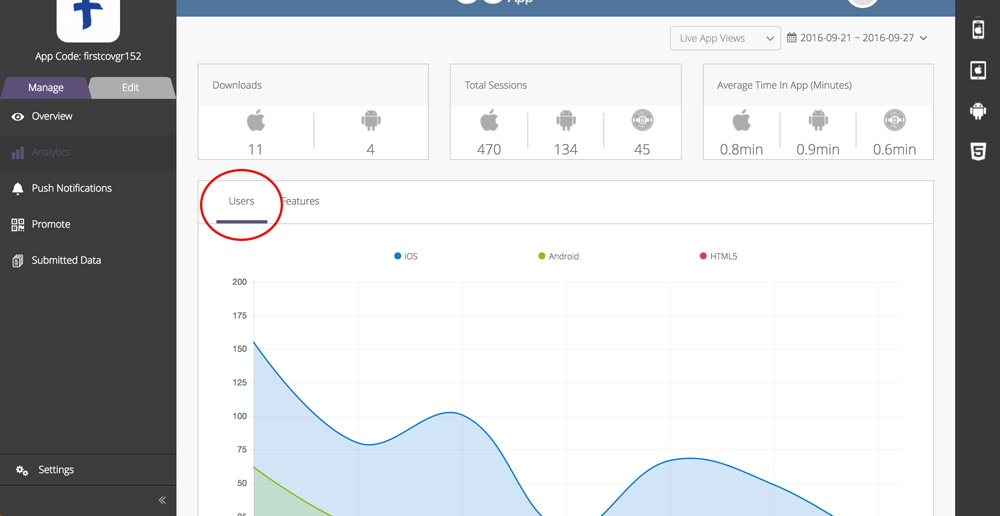
- In the graphs section, the Users tab will reveal the total number of sessions by device. Hover over the graph to see exact dates and data.

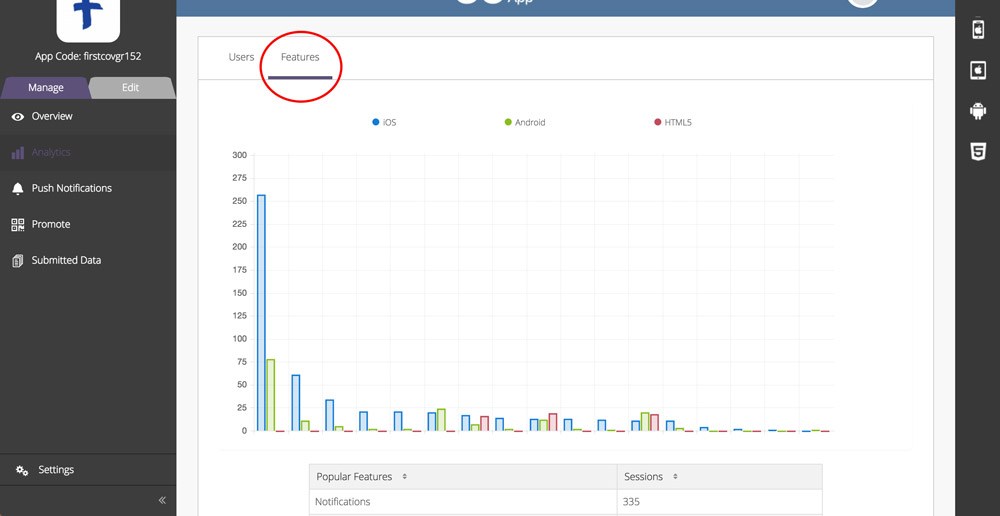
- In the graphs section, the Features tab will reveal total number of sessions per feature by device. Hover over the graph to see features and sessions by device. Also, view the chart below to view total number of sessions per feature within your selected date range.


